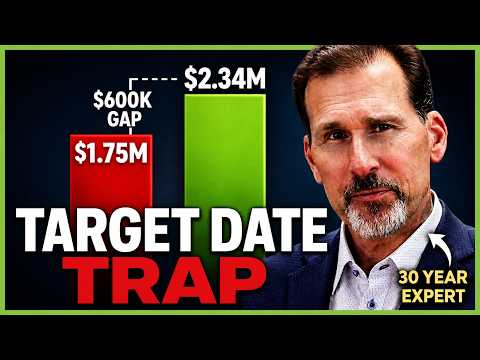
The Lie Behind Forward P/E (It's Wrecking Your Investments)
Most investors trust the Forward P/E ratio to tell them whether stocks are cheap, but what if that number is built on fiction? In this episode of What the Pros Watch, we expose how Forward P/E gets…
Published June 25, 2025
Transcript
You've heard this one before. Stocks look cheap. The forward PE is only 22 times. But hang on, what if that number is built on a fantasy?
A lot of folks, investors, talking heads, even some advisers, they lean hard on this forward PE or the price to earnings ratio. They'll tell you it's a quick way to know if stocks are cheap. But here's the problem. It's based on estimates that are often dead wrong.
I've been in the financial management world for over 33 years and I've seen how this metric gets misused and how that misuse can derail portfolios. So today I'm showing you the real story behind forward PE. We'll cover what it is and where it actually comes from, why it often fails, especially right before a market crash.
Welcome to episode two of What the Pros Watch, a series here on We're Talking Money that's all about what the pros use and how they use it. If you missed episode 1, we tackled the Shiller CAPE ratio. We'll link that video in the description below. Today, it's all about forward PE, one of the most quoted and misunderstood metrics in investing.
First, what is the PE ratio exactly? PE ratio or price to earnings. It tells you how much investors are paying for a dollar of a company's earnings. If a stock trades at $100 and earns $5 per share, its PE ratio is 20, meaning investors are paying $20 for every $1 of earnings. That's the trailing PE ratio and it's based on the last month or the last 12 months.
But forward PE ratios, that's based on projected earnings over the next 12 months. And that's where things can get dicey. Forward PE takes the current stock price and it divides it by what Wall Street analysts think a company will earn over the next 12 months. Sounds simple, right?
But here's the first trap. Those earnings numbers are guesses at best. They're estimates. Sometimes good, sometimes they're wrong, and they're always optimistic. In fact, studies show that analysts consistently overestimate future earnings by 20 to 50%, especially during bull markets.
So, why is this a problem? Because when you hear the market is trading 22 times projected earnings, it sounds like a fact. It's not a fact. It's a forecast. And forecast can be dangerously wrong. And by the way, 22 times earnings is a long way from what is considered fairly valued, but that's for another show.
Now, companies know this game and they play it very well. They manage guidance. They tell analysts just what they want them to believe. And analysts, well, they like being invited back to the next earnings call.
Here's how this plays out. In bull markets, forward PE often looks deceptively low because analysts project earnings growth that doesn't always materialize. And along the way, close to earnings release. These same analysts are often forced to make adjustments. After all, no one wants the company to look bad. You see, forward PE reflects market psychology more than actual value. And when markets are euphoric, this metric gets dangerously out of sync with reality.
Now, I'm not saying that forward PE is worthless. Pros do use it. We use it, but in specific ways. First, it's great for comparing valuation between sectors. For example, tech versus utilities versus industrials. If one sector's forward PE is wildly above its historical average, that's a clue that it may be overvalued.
Second, tracking changes in forward PE can show earnings momentum or weakness. If forward PE is dropping not because prices are falling, but because earnings are improving, that's a really bullish sign.
And third, pros pair forward PE with more reliable metrics like trailing PE or that Shiller CAPE that we talked about. If forward PE says cheap, but CAPE says expensive, you have to be skeptical.
Let me show you two real world examples that reveal just how misleading forward PE can be. 2007, late in that year, forward PE looked reasonable around 15 to 16 times. Analysts were projecting strong earnings into 2008. Reality, the E or the earnings part of the equation, it just never showed up. Earnings collapsed and the market plunged more than 50%.
Conversely, in March 2020, after the COVID crash, forward PE looked scary, soaring above 20 times. But that was because prices fell faster than the analyst could adjust their estimates. But savvy investors, they knew to look deeper, and those who did were richly rewarded.
Before I give you the final takeaway, if you found this helpful, give the video a like and share it with someone who still swears by forward PE. You might just save them a lot of money.
What's the takeaway? Forward PE is a tool, not a truth. The pros never rely on it in isolation. They cross-check it with longer-term valuation signals, cash flow models, and most importantly, they understand the human biases baked into analyst estimates.
So, the next time you hear someone say stocks look cheap on forward PE, you better ask yourself, cheap based on what? That's what separates professional investors from performance chasers.
In our next episode, we're going to tackle another powerful and surprisingly predictive metric. It's called market cap to GDP. And Warren Buffett himself calls this one of the best single indicators of market value. In fact, he still uses it to this day. Subscribe now so you don't miss it. It's going to be a great show.
And if there's a particular metric you'd like me to break down, drop it in the comments below. I read every one and I'm always looking for feedback. Click or tap the screen now to watch the next video in this series or check out the link in the description for the full playlist. Invest smart, stay skeptical, and I'll see you next
This transcript was generated automatically and may contain errors in names, figures and terminology. The episode itself is the authoritative version.